Changelog
Jun 18, 2024

May 31, 2024
New Connector: Databricks

Our Databricks connector is NOW live!
You can now connect to your Databricks SQL warehouse within a few clicks and start using natural language to query your database and visualize data.
Getting Started:
1. Go to “Data Sources” in your dashboard and create a new data source.
2. Select “Databricks” and fill in the database credentials.
3. Test your connection and Create!
New Connector: Databricks
Our Databricks connector is NOW live!
You can now connect to your Databricks SQL warehouse within a few clicks and start using natural language to query your database and visualize data.
Getting Started:
1. Go to “Data Sources” in your dashboard and create a new data source.
2. Select “Databricks” and fill in the database credentials.
3. Test your connection and Create!
May 22, 2024
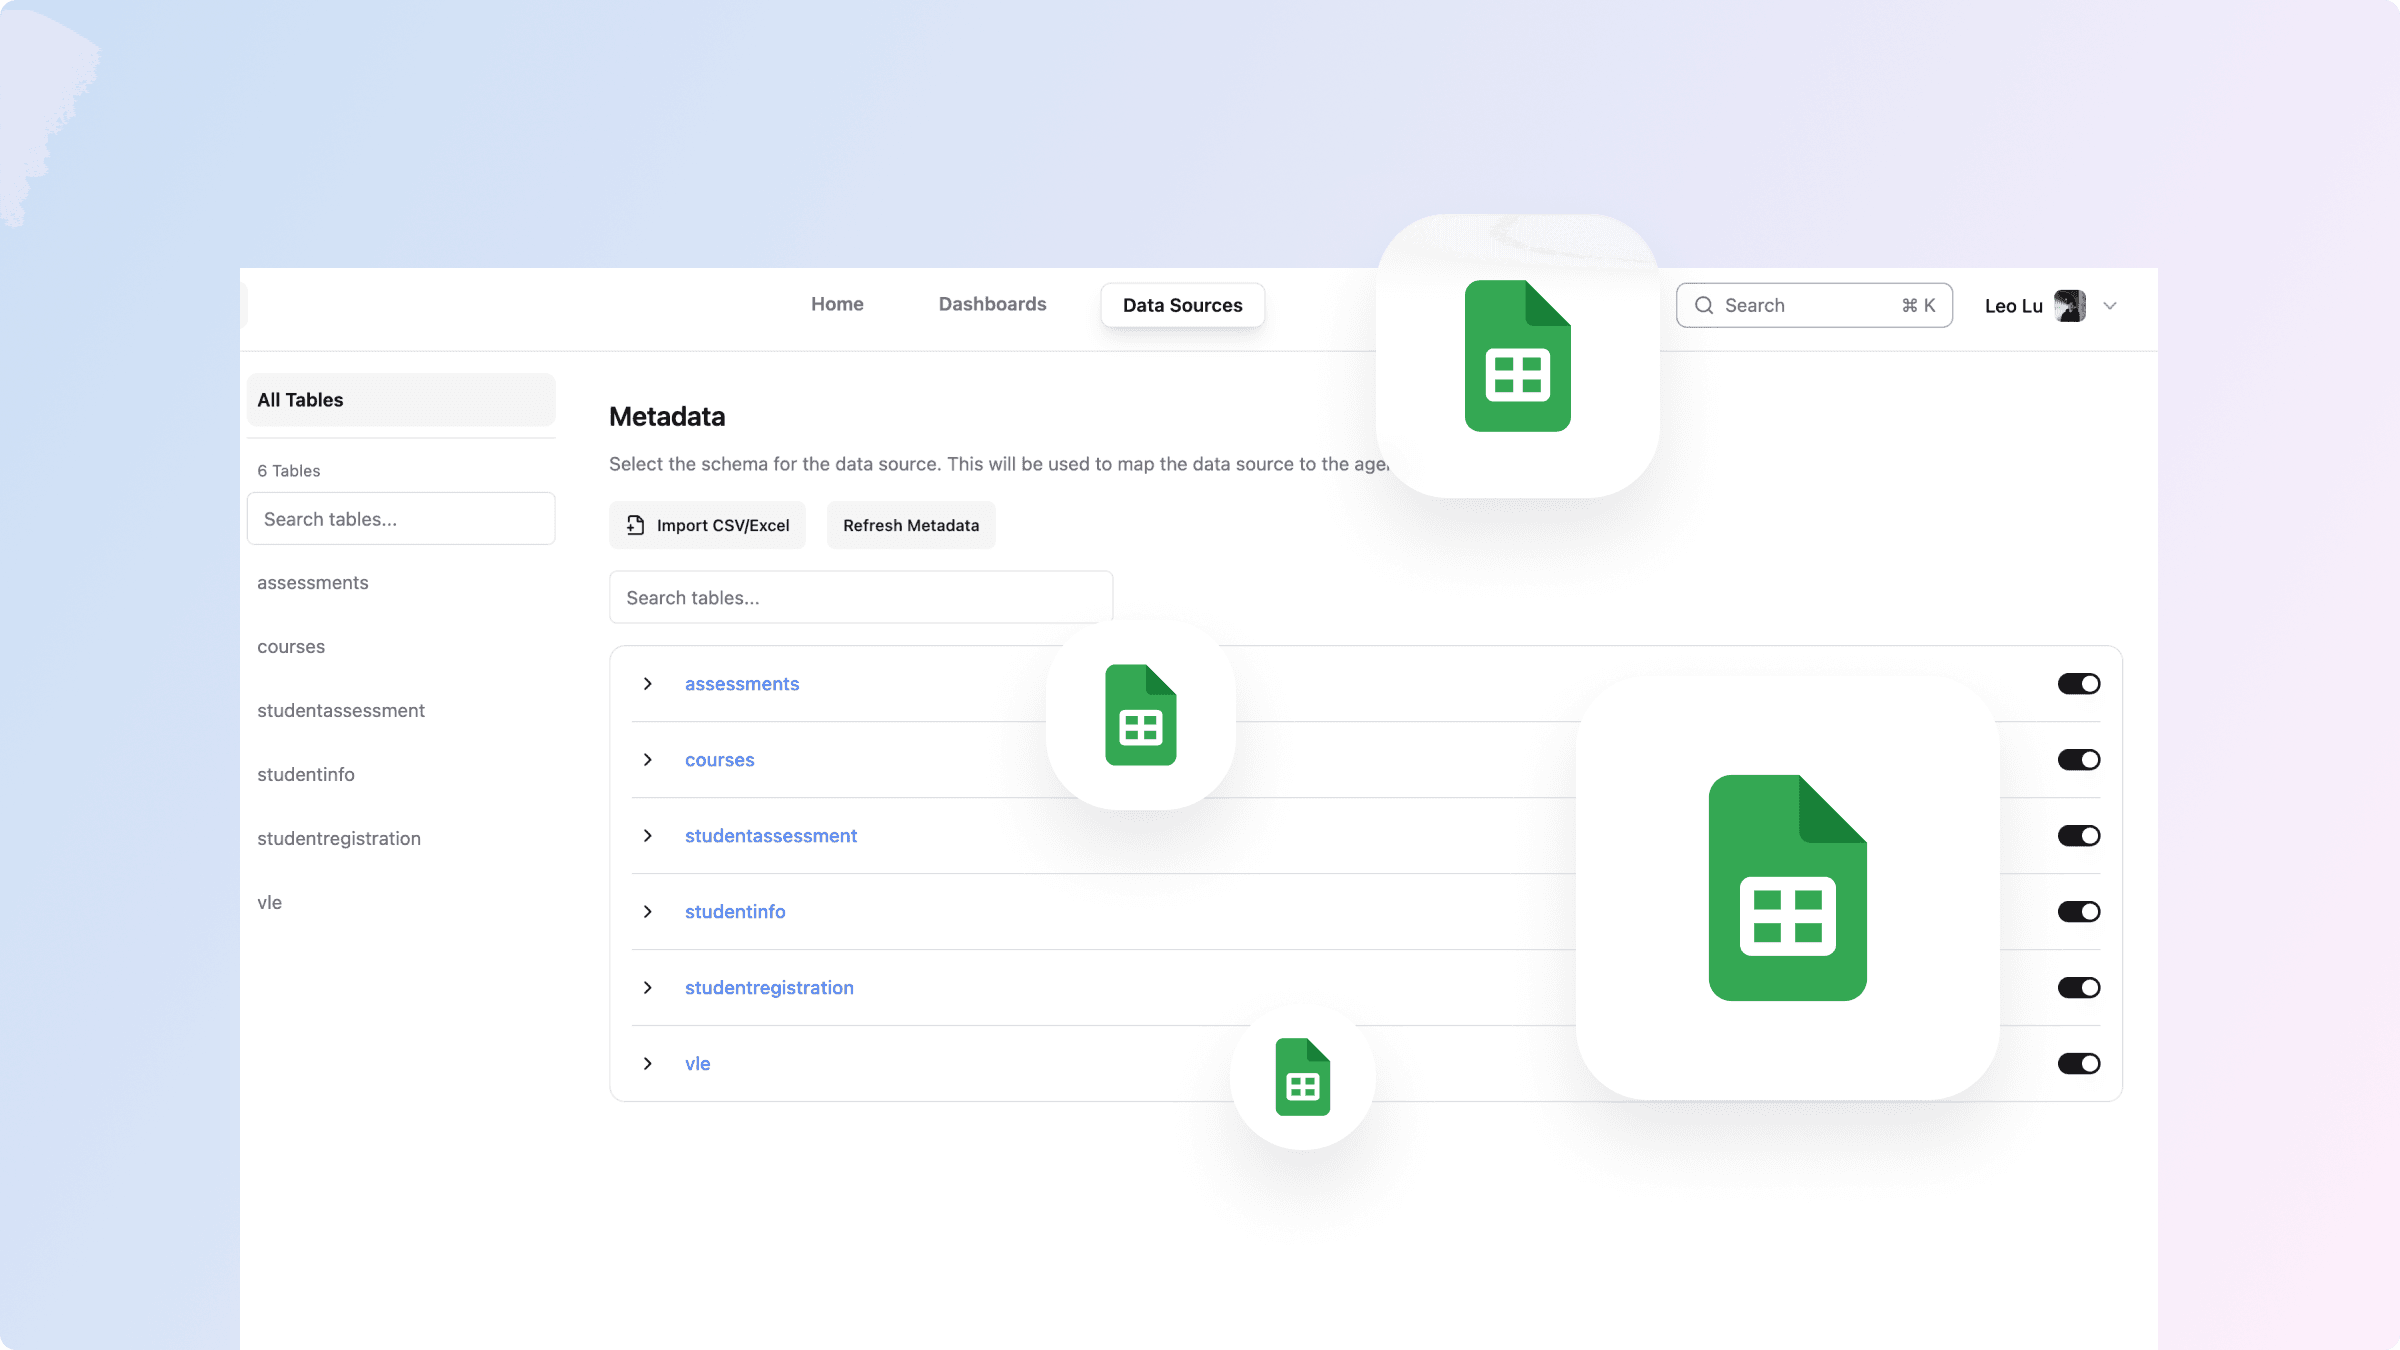
View Tables Used in Chat
Users can now view which relevant tables are used for a chat response.
This new functionality enhances transparency and traceability in your data analysis process by allowing you to view the sources of data directly within the chat interface. You can also see a preview of the table to have a better understanding on how the data in the tables look like.
May 21, 2024
Connecting databases via SSH tunnels
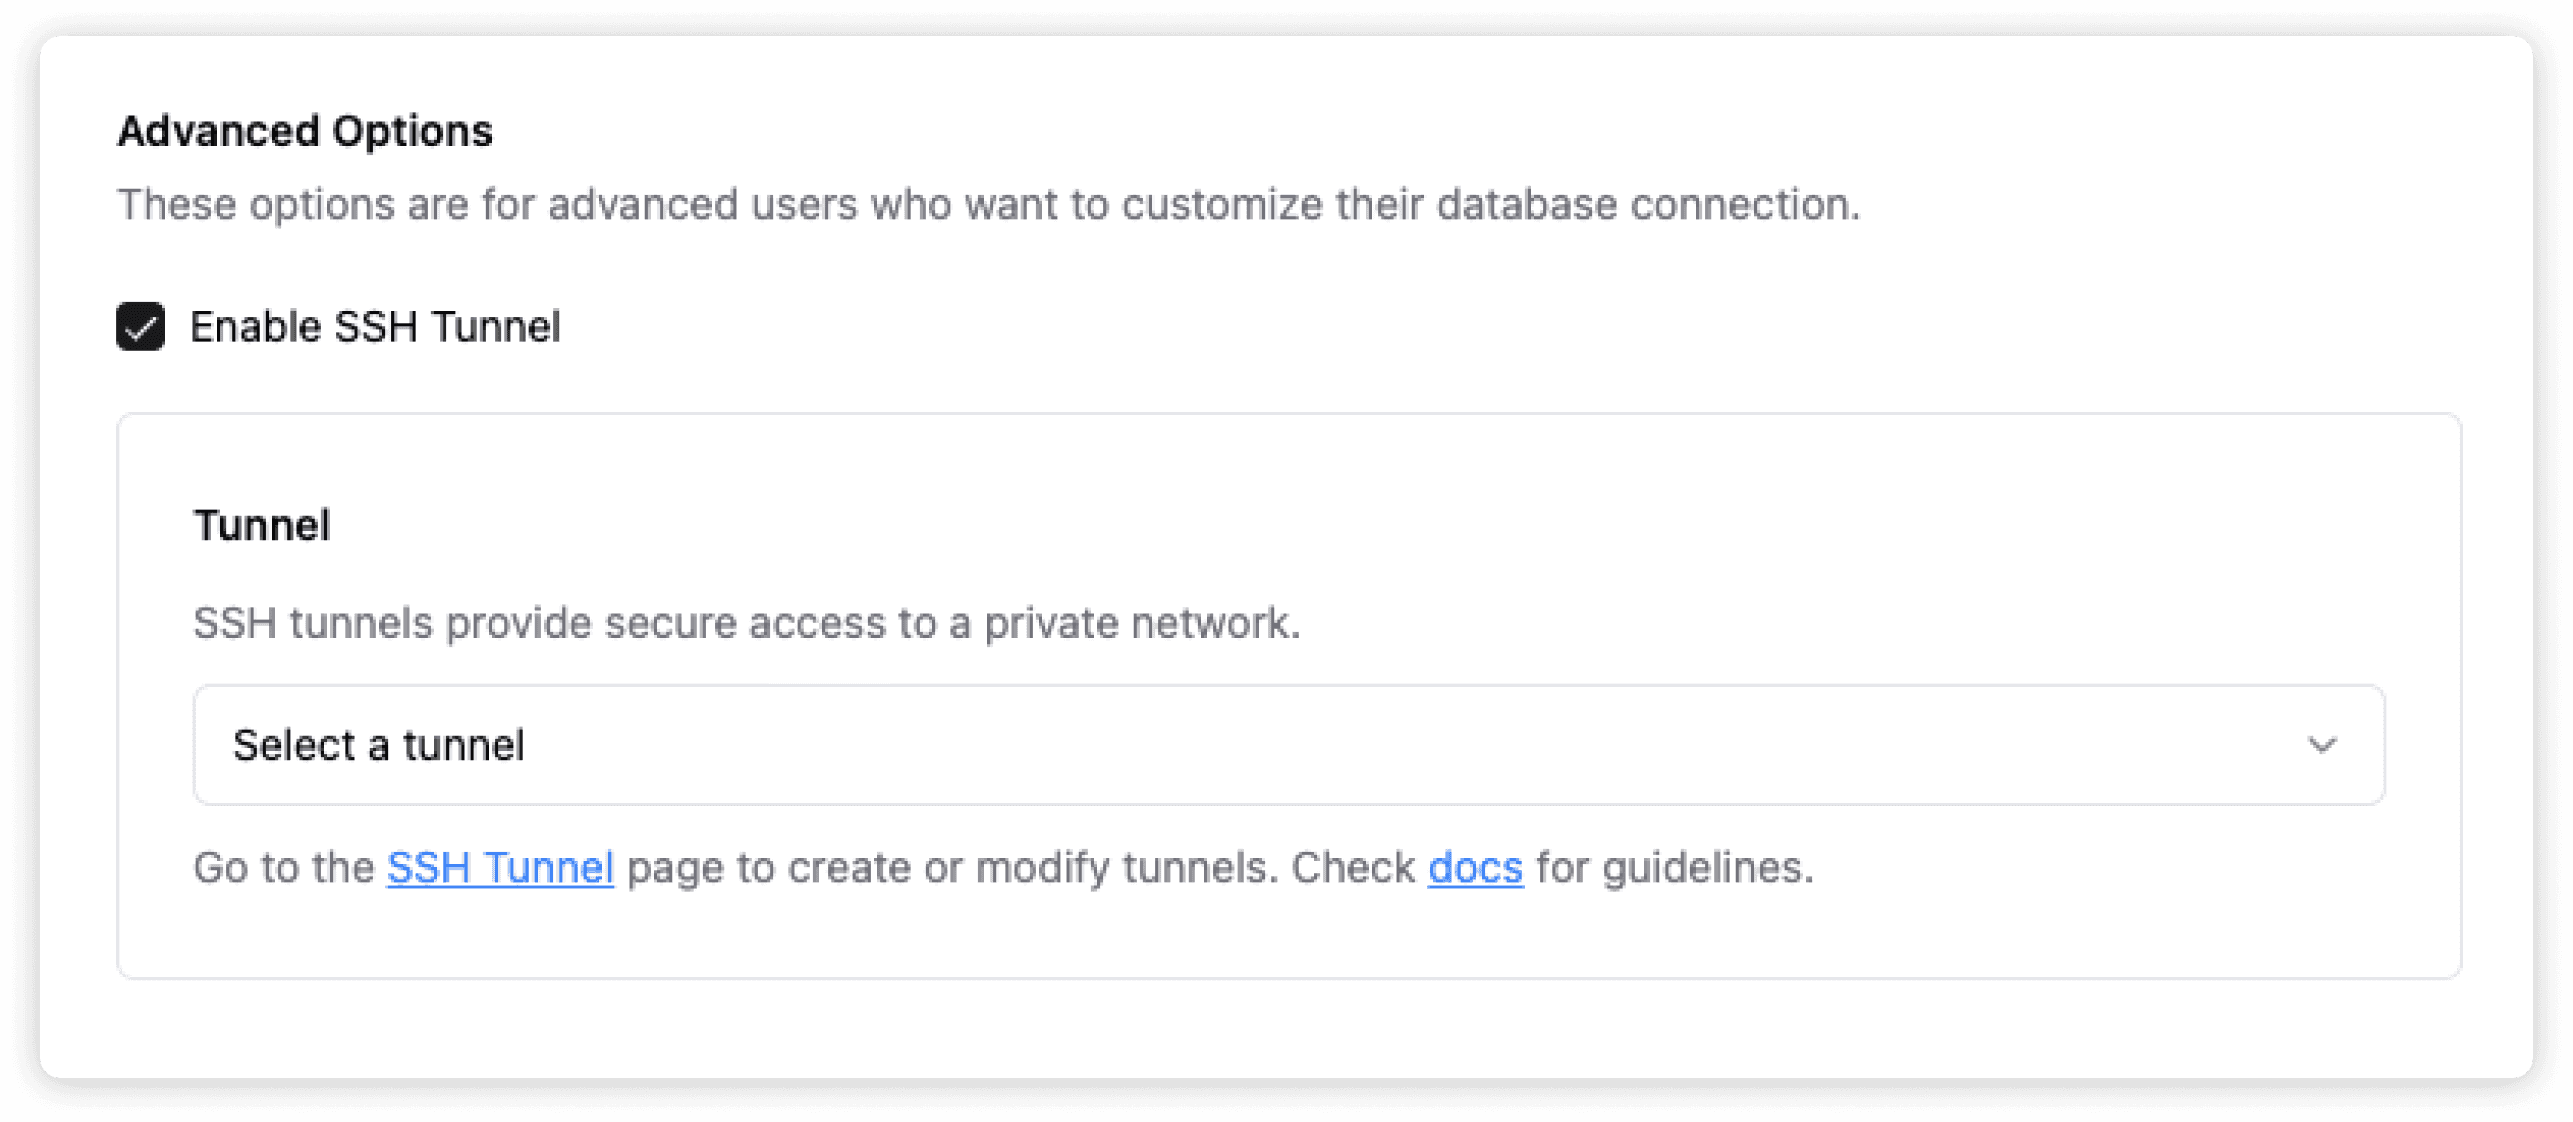
Brewit now supports connecting to your databases via SSH tunnels! This new feature enhances security and flexibility, allowing you to securely connect to databases that are behind firewalls or only accessible via internal networks.
Key Benefits:
Enhanced Security: Your data remains secure as the SSH tunnel encrypts the connection between Brewit.ai and your database.
Access Control: Connect to databases that are restricted to internal networks without exposing them to the public internet.
Simplified Setup: Easily configure SSH tunnel settings directly within the Brewit.ai interface.
How to Use:
Navigate to Data Source: Go to the Data Sources page and create a connection.
Add SSH Details: Choose the option to connect via SSH tunnel, and enter the required SSH details (host, port, username, private key).
Connect Your Database: Enter your database connection details and save the configuration.
For detailed instructions, please refer to our documentation.
Connecting databases via SSH tunnels
Brewit now supports connecting to your databases via SSH tunnels! This new feature enhances security and flexibility, allowing you to securely connect to databases that are behind firewalls or only accessible via internal networks.
Key Benefits:
Enhanced Security: Your data remains secure as the SSH tunnel encrypts the connection between Brewit.ai and your database.
Access Control: Connect to databases that are restricted to internal networks without exposing them to the public internet.
Simplified Setup: Easily configure SSH tunnel settings directly within the Brewit.ai interface.
How to Use:
Navigate to Data Source: Go to the Data Sources page and create a connection.
Add SSH Details: Choose the option to connect via SSH tunnel, and enter the required SSH details (host, port, username, private key).
Connect Your Database: Enter your database connection details and save the configuration.
For detailed instructions, please refer to our documentation.
May 9, 2024
New Connector: Microsoft SQL Server

Now you can connect to your Microsoft SQL Server and start analyzing your data using natural language.
How it works:
Connect to Microsoft SQL Server: Navigate to the Data Sources section, select Microsoft SQL, and follow the on-screen instructions to establish a connection.
Add semantic layer: Add table and column descriptions, sample queries, and metric definitions to increase the accuracy of the AI agent's response.
Analyze data using natural language: Utilize Brewit's BI agent to analyze and visualize your Microsoft SQL datasets using natural language
For detailed instructions, please check out our Microsoft SQL Server Connector Guide.
New Connector: Microsoft SQL Server
Now you can connect to your Microsoft SQL Server and start analyzing your data using natural language.
How it works:
Connect to Microsoft SQL Server: Navigate to the Data Sources section, select Microsoft SQL, and follow the on-screen instructions to establish a connection.
Add semantic layer: Add table and column descriptions, sample queries, and metric definitions to increase the accuracy of the AI agent's response.
Analyze data using natural language: Utilize Brewit's BI agent to analyze and visualize your Microsoft SQL datasets using natural language
For detailed instructions, please check out our Microsoft SQL Server Connector Guide.
May 4, 2024
Evaluate text-to-SQL against your database
We're excited to announce the launch of the Evaluation feature in Brewit! This powerful tool is designed to support data teams in rigorously assessing our text-to-SQL model directly against their databases. With the Evaluation feature, users can:
Run custom tests on your databases: Easily set up a series of questions that test the accuracy and performance of Brewit's text-to-SQL agent. You can also generate the evaluation questions with our user-friendly AI-powered tool.
Optimize answer accuracy: Add correct queries into Query Library to ensure answer accuracy in the future.
Build confidence in the model output: Empower your team and data consumers to trust the model's outputs through transparent and detailed testing results.
This feature is tailored to enhance transparency and boost confidence in the model's capability to handle real-world data scenarios effectively. Dive into the Evaluation module today and start testing with your own data!
Apr 9, 2024
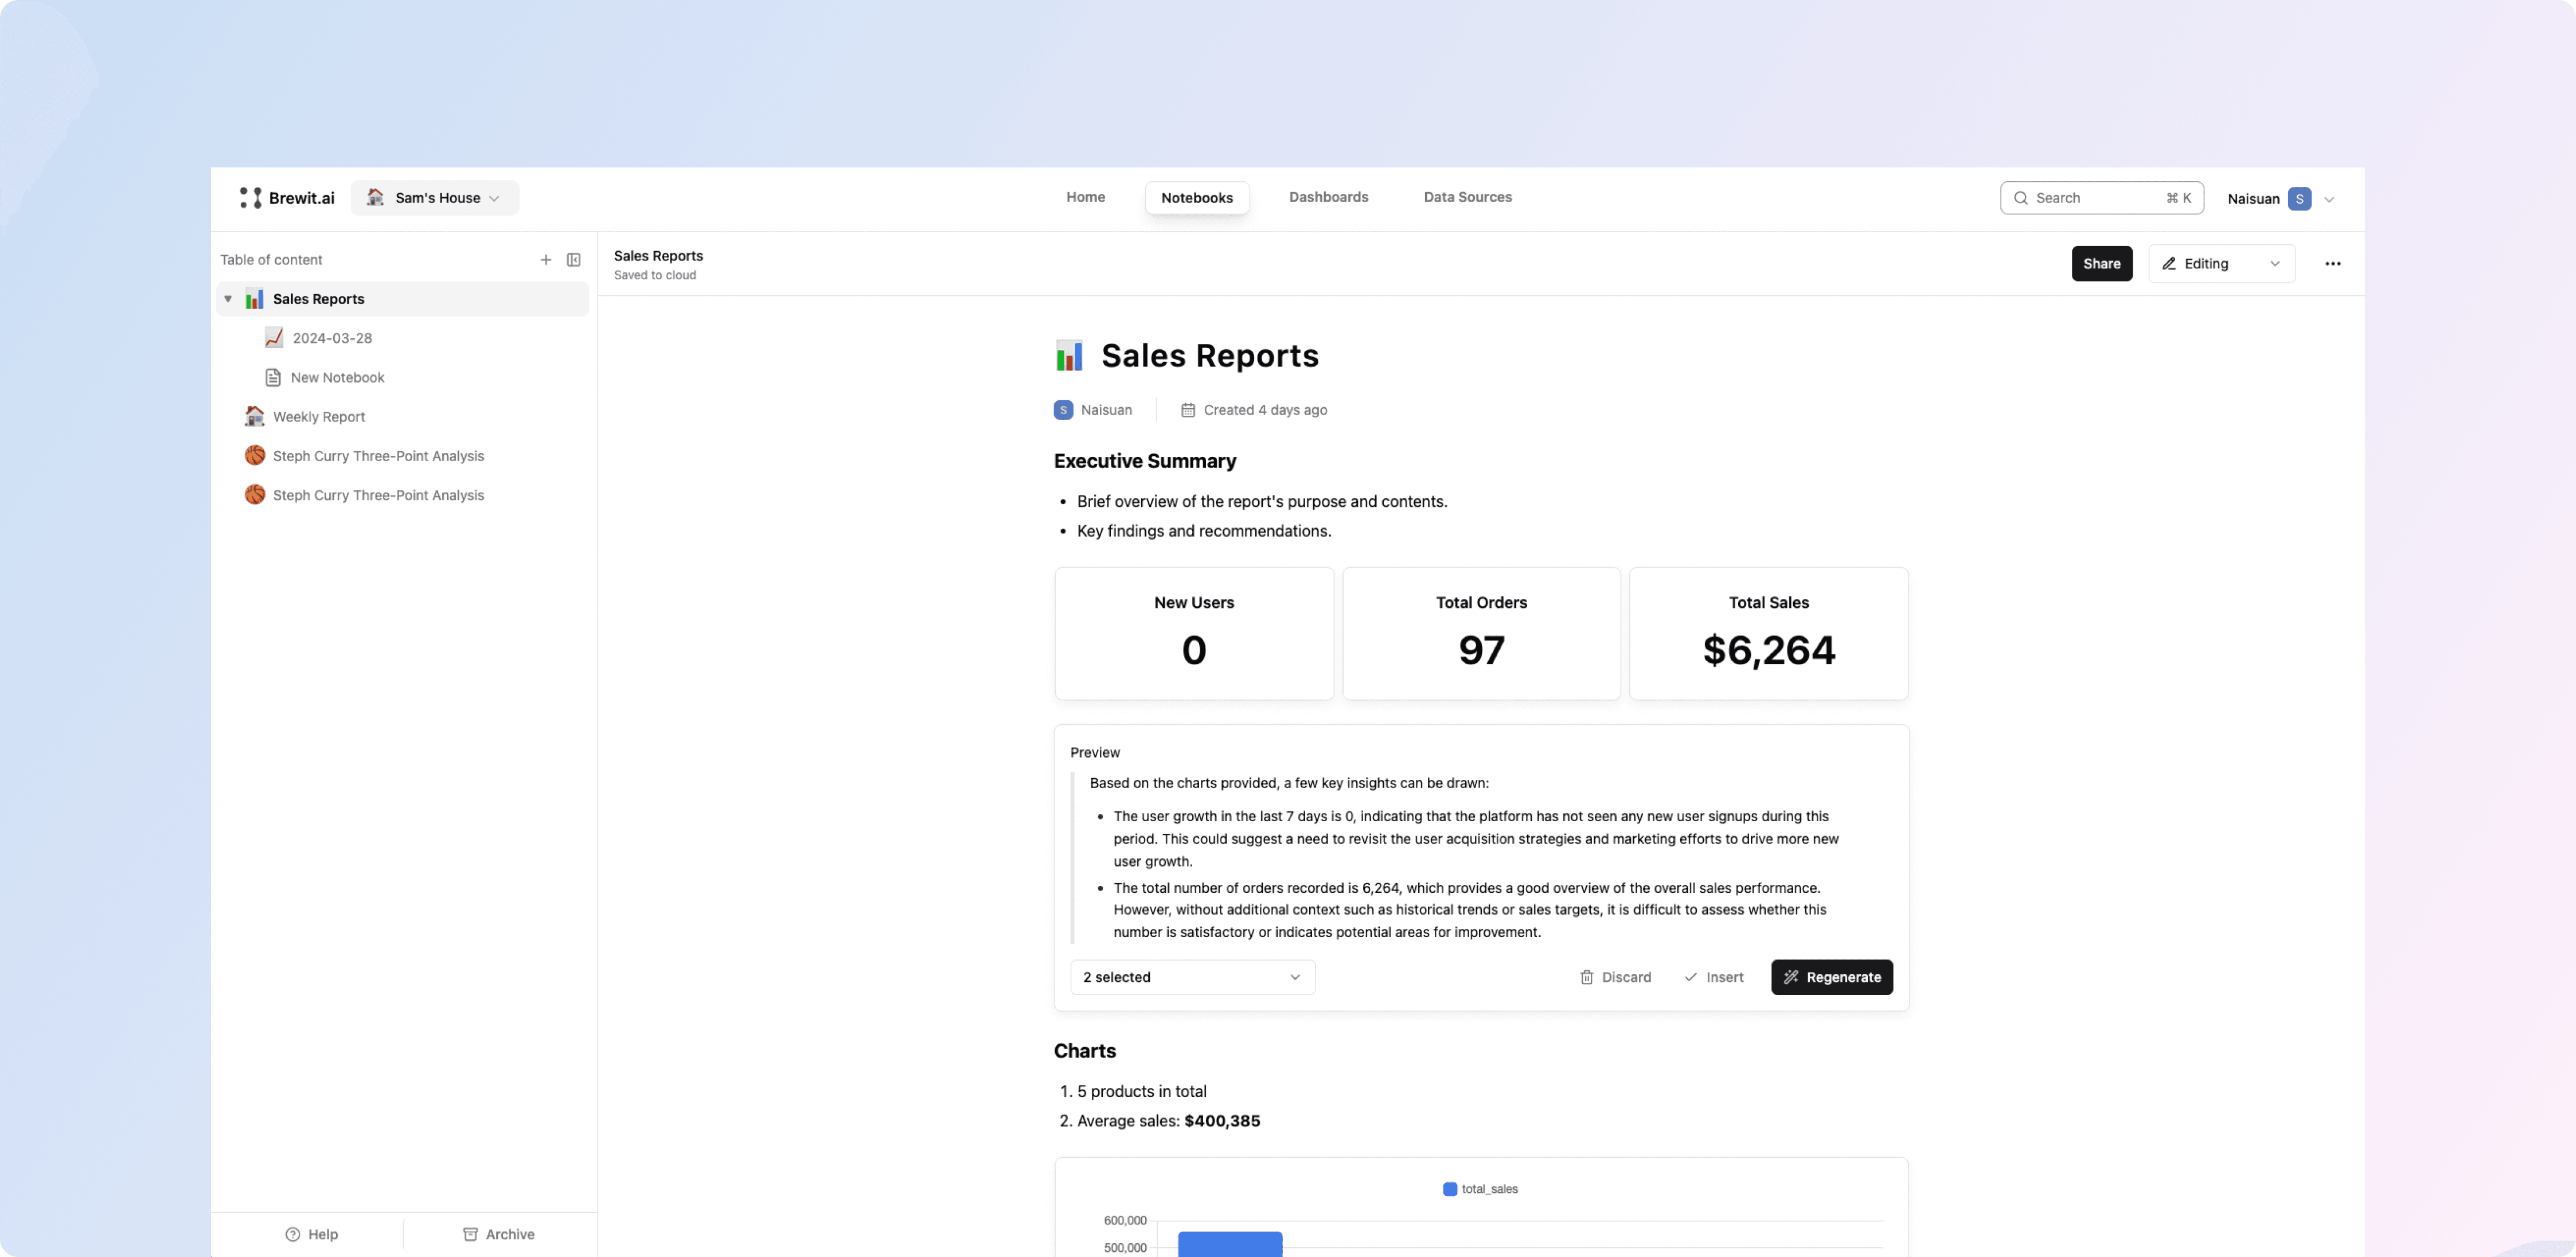
Notebooks: Notion-styled Dashboards
Discover how to leverage the Notebooks for creating dynamic reports, documentation, and data visualizations with an AI-assisted editor.
Key Highlights:
🪄 Generate Chart Insights : Select multiple charts and ask Brewit to generate insights about the data. In addition, you can regenerate the response if the result doesn't work out.
🚀 Powerful reports: Whether you’re compiling research, drafting project documentation, or generating data-driven reports, Notebooks can streamline your workflow and enhance the clarity of your presentations.
📄 Organize with Layers: Structure your notebook using up to three layers of notebooks for a hierarchical organization.
Apr 1, 2024
Suggested Questions: Kickstart your analytics process
We're excited to introduce Suggested Questions, the newest feature in Brewit's arsenal, designed to supercharge your data analysis journey.
Key Highlights:
✨ AI-Generated Questions: Get a head start on your analytics with AI-crafted recommendation questions tailored to your data source, be it CSV files, databases, or others.
🚀 Inspire Your Analysis: Uncover new insights and directions for exploration within your dataset. A simple and effective way to deepen your data understanding.
Mar 20, 2024
Workbook: Brewit-Hosted PostgreSQL Database
We're thrilled to unveil Workbook, the latest addition to Brewit's suite of features designed to enhance your data management and analysis capabilities.
Key Highlights:
🔄 Easy Data Uploads: Import your data effortlessly with support for both CSV and Excel file formats. Simply drag and drop your files to get started.
📊 Unified Database Approach: Treat your workbook like a database. Organize and manage all your data under one roof, making data analysis more streamlined than ever.
🛠 Custom Queries: Fine-tune your data with saved queries. Workbook allows you to add custom queries to your database, enabling you to analyze your data exactly how you need to.
🔧 Enhanced Data Manipulation: Beyond simple data storage, Workbook enables advanced data manipulation. Filter, sort, and explore your data with ease, all within the Brewit platform.
Feb 20, 2024
New Connector: Snowflake

Now you can connect to your Snowflake data warehouses and start analyzing your data using natural language.
Getting Started
Connect to Snowflake: Navigate to the Data Sources section in Brewit.ai, select Snowflake, and follow the on-screen instructions to establish a connection.
Add semantic layer: Add table and column descriptions, sample queries, and metric definitions to increase the accuracy of the AI agent's response.
Analyze data using natural language: Utilize Brewit's BI agent to analyze and visualize your Snowflake datasets using natural language
For detailed instructions and tips on how to make the most out of the BigQuery connector, please check out our Snowflake Connector Guide.
New Connector: Snowflake
Now you can connect to your Snowflake data warehouses and start analyzing your data using natural language.
Getting Started
Connect to Snowflake: Navigate to the Data Sources section in Brewit.ai, select Snowflake, and follow the on-screen instructions to establish a connection.
Add semantic layer: Add table and column descriptions, sample queries, and metric definitions to increase the accuracy of the AI agent's response.
Analyze data using natural language: Utilize Brewit's BI agent to analyze and visualize your Snowflake datasets using natural language
For detailed instructions and tips on how to make the most out of the BigQuery connector, please check out our Snowflake Connector Guide.
Feb 10, 2024
New Connector: BigQuery

Now you can connect to your BigQuery data warehouses and start analyzing your data using natural language.
Getting Started
Connect to BigQuery: Navigate to the Data Sources section in Brewit.ai, select BigQuery, and follow the on-screen instructions to establish a connection.
Add semantic layer: Add table and column descriptions, sample queries, and metric definitions to increase the accuracy of the AI agent's response.
Analyze data using natural language: Utilize Brewit's BI agent to analyze and visualize your BigQuery datasets using natural language
For detailed instructions and tips on how to make the most out of the BigQuery connector, please check out our BigQuery Connector Guide.
New Connector: BigQuery
Now you can connect to your BigQuery data warehouses and start analyzing your data using natural language.
Getting Started
Connect to BigQuery: Navigate to the Data Sources section in Brewit.ai, select BigQuery, and follow the on-screen instructions to establish a connection.
Add semantic layer: Add table and column descriptions, sample queries, and metric definitions to increase the accuracy of the AI agent's response.
Analyze data using natural language: Utilize Brewit's BI agent to analyze and visualize your BigQuery datasets using natural language
For detailed instructions and tips on how to make the most out of the BigQuery connector, please check out our BigQuery Connector Guide.
Jan 14, 2024
Dashboard
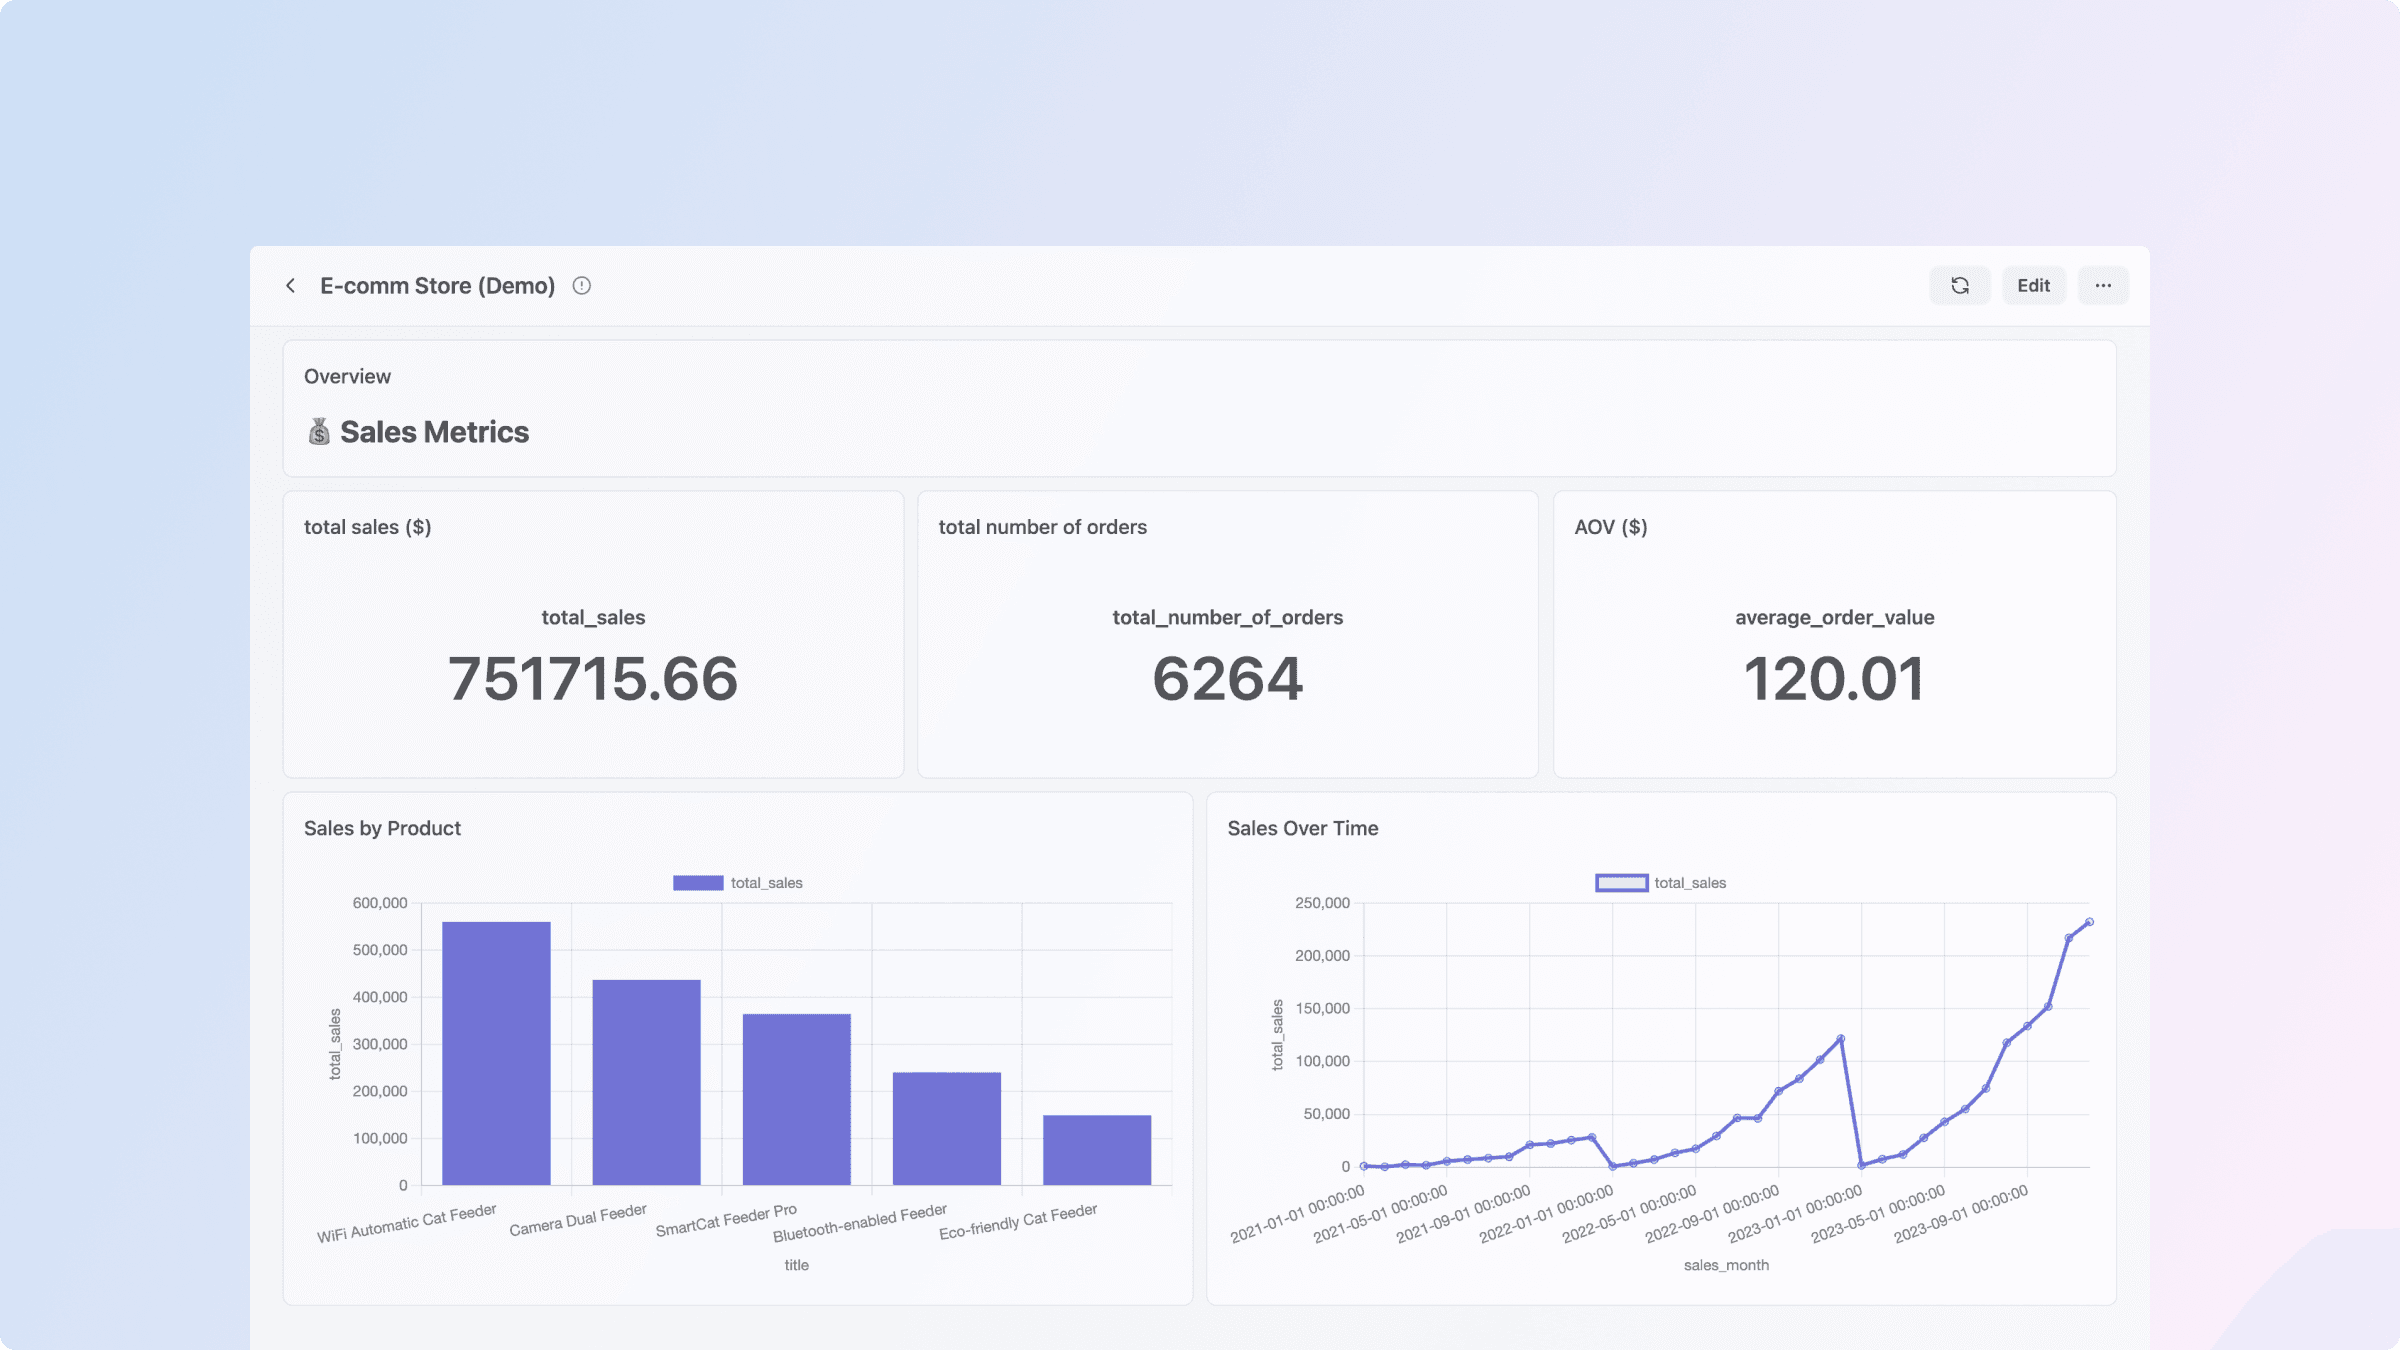
Introducing Dashboard: Create and customize dashboards effortlessly with AI.
Key Highlights:
Easy Creation: User-friendly interface with drag-and-drop functionality.
AI agent: Directly uses charts from conversational queries.
Customization: Variety of interactive chart types for in-depth data exploration.
Collaboration and Sharing: Share dashboards with your team, and export for reports.
Check the Dashboard tab in Brewit.ai and build your first dashboard today.
Dashboard
Introducing Dashboard: Create and customize dashboards effortlessly with AI.
Key Highlights:
Easy Creation: User-friendly interface with drag-and-drop functionality.
AI agent: Directly uses charts from conversational queries.
Customization: Variety of interactive chart types for in-depth data exploration.
Collaboration and Sharing: Share dashboards with your team, and export for reports.
Check the Dashboard tab in Brewit.ai and build your first dashboard today.
Dec 15, 2023
New: Search Bar
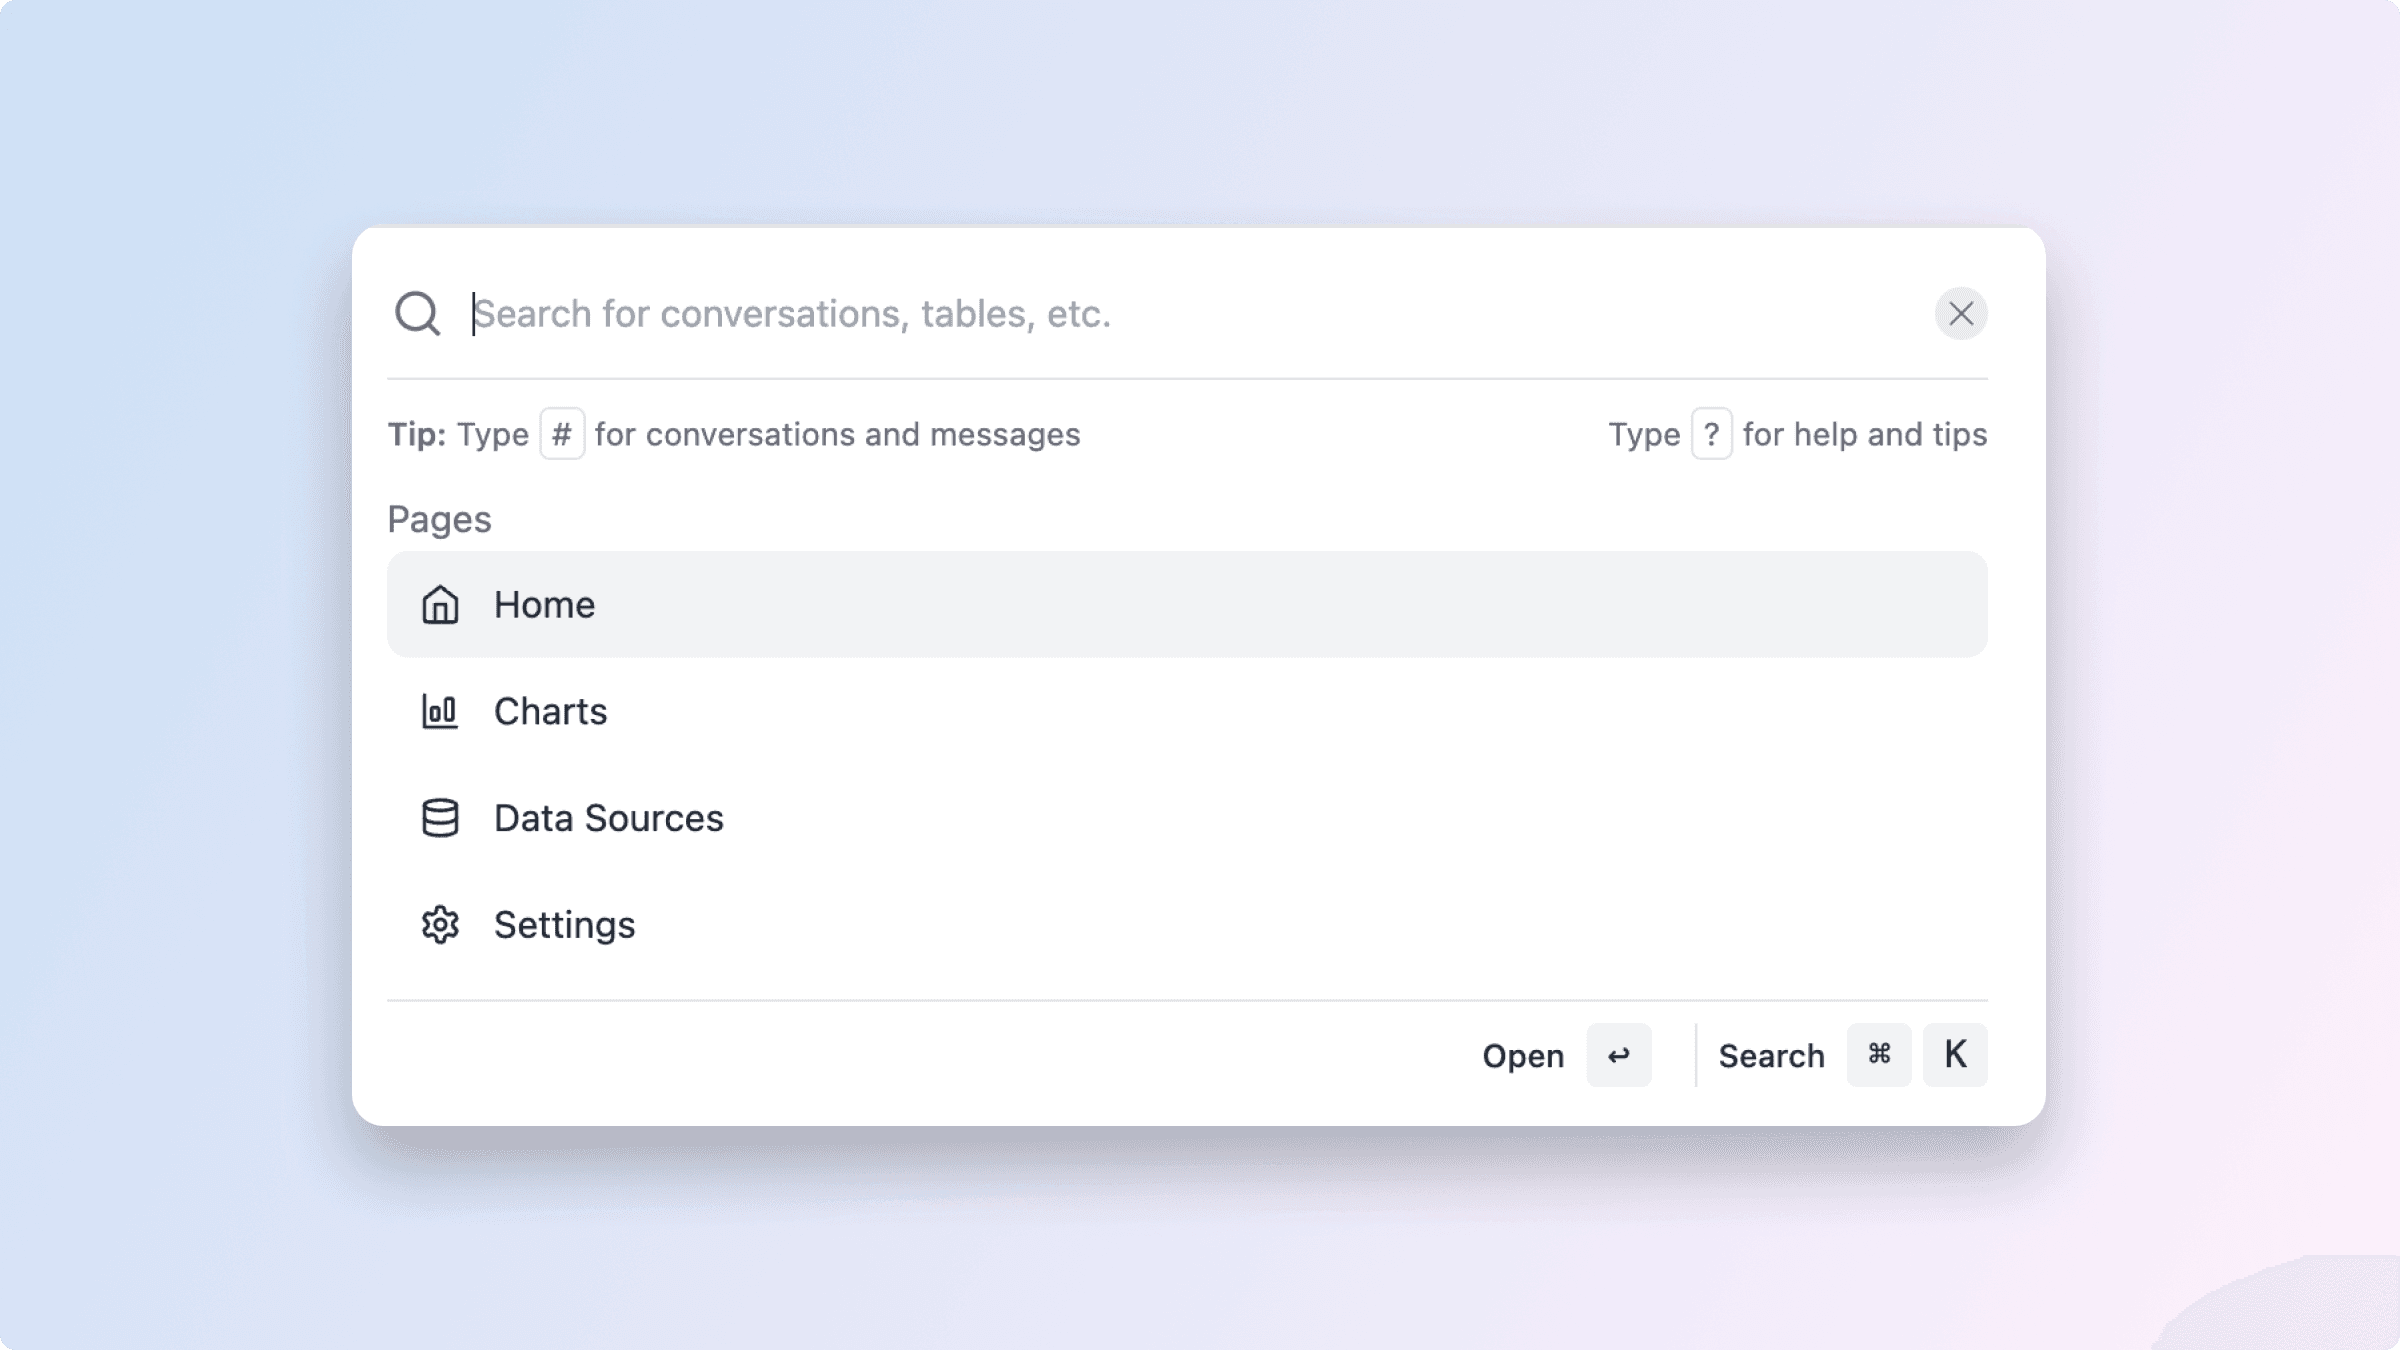
With Brewit's search bar, you can now navigate through your entire chat history, charts, data sources, and settings with ease. You can find the search bar in the top right corner of the app. You can also use Command ⌘K to open the search bar.
If you are a keyboard shortcut enthusiast, here are 3 shortcuts that you might like:
#- Only search in chat messages (ex.#order- search all messages that contain "order")!- Only search in data resources (ex.!shopify)/- Only search for database tables and columns (ex./user_table)
New: Search Bar
With Brewit's search bar, you can now navigate through your entire chat history, charts, data sources, and settings with ease. You can find the search bar in the top right corner of the app. You can also use Command ⌘K to open the search bar.
If you are a keyboard shortcut enthusiast, here are 3 shortcuts that you might like:
#- Only search in chat messages (ex.#order- search all messages that contain "order")!- Only search in data resources (ex.!shopify)/- Only search for database tables and columns (ex./user_table)
Nov 21, 2023
New Workspace Analytics
We are excited to announce the launch of Brewit's new Workspace Analytics feature to provide enhanced visibility into how your teams are using Brewit to collaborate.
The initial release includes reporting on the following key engagement metrics:
Total Active Users - Track daily, weekly, and monthly active users over time to measure engagement levels across your organization
Messages per Channel - View number of messages sent in each Brewit channel to identify where collaboration is most active
External Data Sources - Monitor usage frequency of connected external data sources like analytics tools, databases, etc. to see popular integrations
Power Users - Get visibility into top contributors with the most messages sent to uncover Brewit experts
As we continue enhancing the product, we will expand analytics capabilities to provide optimization insights that ensure Brewit enables seamless teamwork across your organization.
Integrate GPT-4 Turbo
We are also excited to share that we've upgraded our model to GPT-4 Turbo (introduced in OpenAI DevDay). What it means to our users is that the usage will be 2~3x cheaper and faster than the previous version. Feel free to try it out here.
Talk to your data today!
Make better data-driven decisions 10x faster with a fraction of the cost


Talk to your data today!
Make better data-driven decisions 10x faster with a fraction of the cost
Talk to your data today!
Make better data-driven decisions 10x faster with a fraction of the cost
Talk to your data today!
Make better data-driven decisions 10x faster with a fraction of the cost
